
Talk Is Cheap
In my last post, I talked about how I was amazed that PostgreSQL doesn’t have a shared plan cache like SQL Server does. I wanted to create an experiment / lab where I could see this in action, so I built one. I’m going to be leveraging a free PostgreSQL database hosted on an Azure Flexible Server. I’ll also be using DBeaver to connect to my PG Database.
Laying The Groundwork
In order to give a good example how “session based plan caching” works in Postgres, I’ll have to create a table with some skewed data in it. This will give the planner more of a reason to choose or create different plans based on the filters I use.
CREATE TABLE plan_cache_demo (
id serial PRIMARY KEY,
status text,
payload text
);
INSERT INTO plan_cache_demo (status, payload)
SELECT
CASE WHEN i % 1000 = 0 THEN ‘rare’ ELSE ‘common’ END,
repeat(‘x’, 50)
FROM generate_series(1, 1000000) AS i;
CREATE INDEX idx_plan_cache_demo_status ON plan_cache_demo (status);
This will give us a million rows, that of which about 1k of them will be “rare” and about 999k of them will be “common”. Also just to address this early on, I made the table with only two distinct values in status on purpose. That way it’s easy to see the generic plan assumption. I recognize columns in prod most likely will have more than just two possible values. This is just for demo and lab purposes to be able to cleanly demonstrate what I’m talking about. I’ll also be creating an index called idx_plan_cache_demo_status on the status column so we can see how Postgres interacts with it.
The Right Plan For The Job
In this testing, when normal or adhoc queries are run, Postgres will compile a plan specifically for that query with its unique filters passed in. Below, I ran two queries. One selecting everything based on all rows that are “common” and another based on all rows that are “rare” in the table.
Common Query

Rare Query

Notice how the “common” query produces a sequential scan and the “rare” query produces an index scan. Nothing was re-used here. This is no different than how SQL Server functions. A passed in unique literal per query will generate the same unique plan behavior between Postgres and SQL Server. I’m just setting the scene here. The point of this isn’t to show that the plan shape changes between what literal is passed in, but in the next section, I’m going to show that there are no plans being reused per literal filter.
Groundhog Day
I found in this lab that even if the same literal is passed in, Postgres will re-compile the plan each time, over and over again. In PostgreSQL DB on Azure, the pg_stat_statements extension is enabled by default. I just had to also turn on pg_stat_statements.track_planning in the server configuration settings in the Azure Portal and then create the extension in Postgres. These are what will allow me to track statistics and metrics on the queries being run. So, I went ahead and ran the following same query 20 times in a single block:
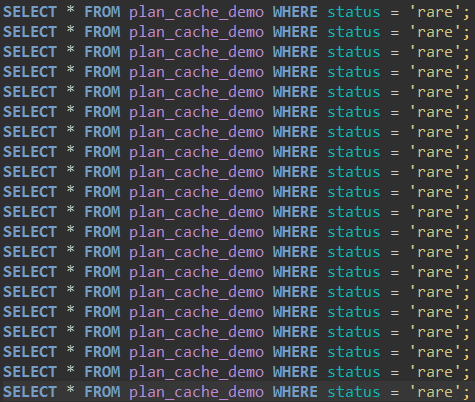
Then, I viewed the metrics gathered from the pg_stat_statements table:
SELECT query, calls, mean_plan_time, mean_exec_time, total_plan_time
FROM pg_stat_statements
WHERE query LIKE ‘%plan_cache_demo%’;
Here were the results:

Breaking this down, here are the values of interest. There were 20 calls, a 0.04106015ms average plan generation time, and a total plan generation time of 0.821203ms. These numbers tell me that Postgres didn’t reuse any plans and compiled a plan each time it executed because of the total_plan_time. If the total_plan_time value were to look like that of one plan generation then that would suggest plan reuse to me. Checking the math here, 0.04106015ms x 20 executions = 0.821202ms. I’m sure there was some rounding or slight variation in compile time per execution which is why it’s not 100% exact, but it’s virtually the same number.
The Other Side Of The Coin
Now, let’s compare this with using the PREPARE / EXECUTE clauses and see how that impacts caching. Referring to Postgres documentation, for prepared sql queries, Postgres will analyze the first five executions of the query, and average out the cost of the custom plan it generates for each one. If the average cost of the custom plan looks worse than the generic plan it generates, then it’ll go with the generic going forward, and vice versa. Let’s see what plan Postgres chooses when I run a prepared query with six executions (five executions for the custom plan analysis and a sixth for it to compare against the generic and land on a plan.

I executed the PREPARE once and then the executes individually. Let’s see what plan Postgres decided on using:

Looks like an index scan on the index we created earlier with a cost of 45.47. Now, for completeness, let’s take a look what happens if we force Postgres to choose a custom plan vs a generic plan (default is auto):
Generic plan

Custom plan

For a reminder and context, I’m doing this demo in my lab and typing as I go, so, as you might be confused as I sure was, it seems that no matter if the decision was left up to Postgres, or if I forced it to do a generic vs custom plan, it was all the same… at face value. It still chose an index scan whether it was a custom, generic, or auto mode. HOWEVER, take a look at the row estimation. With Postgres making the decisions with auto plan choice, you can see that rows =1067. When I forced generic, we see rows=500000. And with custom rows=1067. What I learned is that generic plans are “good enough”. Not just for plan shape and operator choice, but with data estimates as well. With my demo table being a million rows with two columns, Postgres took the approach of doing an even data distribution and splitting the data estimates up right down the middle. Here’s how Postgres came up with its decision. Apparently, every Postgres plan reports cost as a range, startup cost and total cost. The forced generic plan came back with a total cost of 15370.71. The forced custom plan came back at 45.47 total. That’s roughly 340 times more expensive. Postgres isn’t just vaguely preferring to recompile, it ran the numbers, saw the generic plan would cost 340x more to run start to finish, and decided that gap was way too big to be worth the savings of skipping replanning. Postgres keeps recompiling forever rather than commit to something that bad. But, I still wanted to see my intended expectation of Postgres choosing to stick with a generic plan, so I flattened the data skew.
Generic Brand Can Be Better Than Name Brand, Right?
Like I said, I needed to adjust the data distribution for Postgres to have a more enticing reason to pick a generic plan. So, that’s what I did. Well, I tried to. See, I thought that if I kept shrinking the ratio of data distribution and eventually brought the number of “rare” values closer to the number of “common” values, Postgres would eventually tip over and choose to stick with a generic plan. I slowly stepped the ratio closer and closer together till I nearly got to a 50/50 split but Postgres would absolutely not choose the generic plan. BUT, I was wrong and not approaching it in the right way. I realized that this will never work because “rare” can never be more than half the table. No matter how close I got to even, querying the minority side was never going to cost more than what generic assumes.
So, instead of querying “rare” I put the table back to the distribution it was, and queried “common” (the majority) instead:
DROP TABLE IF EXISTS plan_cache_demo;
CREATE TABLE plan_cache_demo (
id serial PRIMARY KEY,
status text,
payload text
);
INSERT INTO plan_cache_demo (status, payload)
SELECT
CASE WHEN i % 3 = 0 THEN ‘rare’ ELSE ‘common’ END,
repeat(‘x’, 50)
FROM generate_series(1, 1000000) AS i;
CREATE INDEX idx_plan_cache_demo_status ON plan_cache_demo (status);
When I let Postgres make the decision of what plan to choose after six individual executions of filtering on “common” this is what it showed:

This right here tells me that it now decided to go with the generic plan (denoted by the row distribution and passing in a parameter value for the status = $1 instead of status = ‘common’). So I realized that it’s BOTH data skew and what value hits first that’ll influence the decision if a generic or custom plan should be used. The skew is what creates a slice of the table sitting above that fifty percent line that generic plan assumes. Which value hits the query during those first five calls is what determines whether Postgres actually finds that slice. Query the small side, no matter how skewed the table is, and you’ll never cross that line. Query the big side, and how far above fifty percent it sits determines how badly custom loses and how fast Postgres says “yeah, no thanks”. My SQL Server brain immediately went to “wait, this is parameter sniffing.” It’s not, but it’s close enough that I get why my brain went there. Parameter sniffing bakes the first value right into the plan and just reuses it, no matter what comes after. That’s not what’s happening here. The generic plan doesn’t care what value you pass in, it never did, that’s the whole point of it. What Postgres is actually deciding, based on those first few calls, is whether to stop looking at the value at all. It seems like a different mechanism with the same gotcha though, whatever hits the query first has way more say over what happens next than it probably should.
One thing I learned the hard way while testing this. Once Postgres makes that generic-vs-custom decision, it sticks. Setting plan_cache_mode back to auto doesn’t undo it, it just controls what happens the next time a fresh decision gets made. If you want Postgres to re-evaluate from scratch, you have to tear down the prepared statement and rebuild it:
DEALLOCATE demo_query;
PREPARE demo_query (text) AS
SELECT * FROM plan_cache_demo WHERE status = $1;
Proving That Postgres “Plan Cache” Is Session Scoped
One of the big claims talked about last time is that Postgres doesn’t have a plan cache. And what all of this testing has shown me is that it kind of does and kind of doesn’t. It doesn’t have a shared server level plan cache like SQL Server where multiple sessions running a similar query can pull from that one location. However, there is a session based plan cache. This whole time I’ve been working with the demo_query prepared sql statement to show how Postgres generates and stores plans for reuse if it chooses to use a generic plan. But this is only scoped to that specific session I was working in. When I opened a new query window and ran the following, I got the following error:

That right there proves that one session cannot see the other’s plan cache. Makes sense why the docs point to prepared statements paying off most when you’re running the same statement over and over in one session, especially if it’s something expensive to plan, like a multi-table join. If it’s a simple query you’re only running a handful of times, the win is just smaller, not that it’s some bad trade.


Leave a comment